Tanulj velem angolul online
Tanulj velem angolul skype-on keresztül, ha otthon tanulnál, de mégis kell segítség. Tudd meg, milyenek a nyelvvizsgafeladatok, sikeresebb leszel!
Példák különböző grafikonok elemzésére
1. Line graph
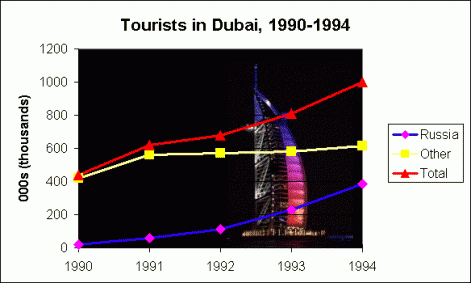
Dubai Tourism, 1990-1994
The graph shows the numbers of tourists in hundreds of thousands visiting Dubai between 1990 and 1994. There are several features in the graph.
First of all, the total number of tourists increased rapidly between 1990 and 1994. In 1990 there was a total of 450,000 tourists in Dubai. This rose sharply to 625,000 in 1991, an increase of more than 30%, and rose slightly again to just under 700,000 in 1992. In the following two years, the number of visitors started to pick up again and reached 1 million in 1994. This was more than double the figure for 1990.
The second trend is that there was a huge increase in the number of tourists from Russia. In 1990, Russian tourists comprised only 20,000 or less than 5% of visitors. This number shot up to 50,000 in 1991 and doubled again to more than 100,000 in 1992. Between 1992 and 1994, the number trebled, from 110,000 to 330,000. This meant that Russian tourists made up one-third, or 33%, of Dubai’s 1 million visitors in 1994. In comparison, the number of tourists from other countries increased only slightly, from 550,000 in 1991 to 580,000 in 1994.
In conclusion, although the number of tourists from all countries is increasing, Russian tourists are becoming more and more important for the tourism industry in Dubai.
2. Combined line graph and bar chart
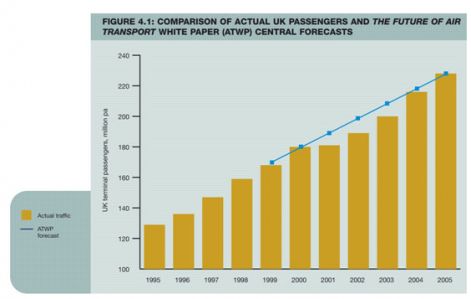
This is a combined bar chart and line graph about the actual UK air passengers compared to the forecasts.
The horizontal axis shows the years, the vertical axis shows the number of passengers in millions per year. In 1995 there were about 120 million passengers. In the following years, up to 2000 their number rose steadily, and it reached more than 160 million. Then in 2001 the number didn't grow, it remained at the level of the previous year. The growing tendency returned in 2002, but first there was only a slight increase. Then the pace of increase quickened up, and by the year of 2005 the number was over 220 million. The line of forecasts started at 1999, where it was a little over the actual number. next year's forecast was correct, but in the next three years the actual number didn't reach the forecasted numbers. However, the forecasts and the actual numbers met in 2005. All in all there was a huge growth in the number of air passengers during this 10 years period, but the growth was not as steady as the it was planned.
3. Two pie charts
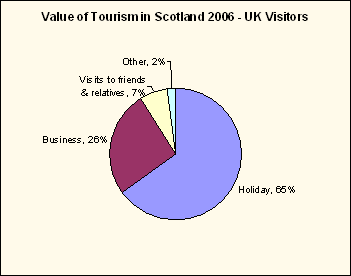
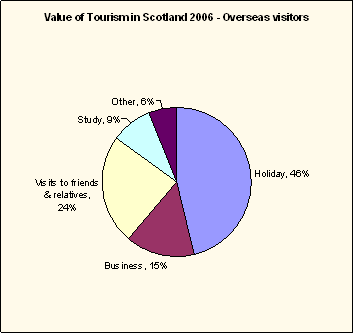
These two pie charts show the value of tourism in Scotland, inland and overseas visitors.
The segments show the reasons why visitors arrived in Scotland, these are holiday, business, visit to friends and relatives and other in the inland visitors' case, and ther is an extra segment - study- in the overseas visitors chart.
In both charts the biggest segment is holidays, but it is much bigger in the inland tourism chart, 65%, than in the overseas visitors chart, 46%.
The segment of business is 10% bigger among the inland visitors than overseas visitors. Visit to friends and relatives segment is more than three times as big in the overseas chart than in the inland chart.
All in all, inland visitors visit Scotland mostly on holiday and business, while international visitors have more purposes.
Persze, lehet még összehasonlító oszlopgrafikon, vagy egy körgrafikon, vagy egy vonalgrafikon is a vizsgán.
Fontos!
1.Csak az összehasonlítható adatokat hasonlítsuk össze.
2. Ha sok adatunk van, a lényeges trendeket mondjuk.
3. Az első adatot mondjuk pontosan, esetleg az utolsót is, a közbeesőknél csak a változást.
4. Nem minden oszlopgrafikon ábrázol folyamatot.
5. Gyakorlás (sok gyakorlás) nélkül nem megy.
6. Egyedül is tudsz gyakorolni, számtalan grafikon található a neten (én is onnan szedem.), de velem is gyakorolhatsz, keress meg skype-on (csernok.eva)
Honlapkészítés ingyen:
Ez a weblapszerkesztő alkalmas
ingyen weboldal,
ingyen honlap készítés...
Mai: 1
Tegnapi: 12
Heti: 1
Havi: 1 536
Össz.: 162 259
Látogatottság növelés
Tanulj velem angolul online - © 2008 - 2025 - csernok.hupont.hu
